

The market is more expensive today than it was a year ago.
Does a move in NIFTY from 10000 to 11000 after one year make it more expensive?
We all hear that, but do we really know what they are talking about?
The P/E ratio is one of the most popular and most used valuation model among many others.
When we read about the average market price-earnings ratio (P/E ratio) going up or going down, what does that really mean?
Remember, that when you buy a stock, you essentially buy a share in the earnings of the company. The P/E ratio refers to the number of times you pay for the profit per share of a company. For example, if a company reports earnings of Rs 1 cr and has 1 lac total shares. Earning per share is Rs 100 and the stock trades at Rs 1100, this means you pay 11 times its profit. In other words, the value of the company is equal to 11 times its profit today. If you own all shares of that company, you would need 11 years to get all of your money back, assuming profit doesn’t change.
What happens when you pay more; Imagine the same company with the same earnings suddenly trades at Rs 1300. It means you are paying more for the same profits and will thus need more time to recover your money.
It’s not easy to conclude whether a stock with a P/E of 10x is a bargain, or a P/E of 50x is expensive without performing any comparisons.
We must remember that even an FDR has an implicit PE ratio. An FDR which bears an interest rate of lets say 5%, means that it has a PE of 20, a 10% Debt Instrument has a PE of 10.
An investor pays a premium over the “Debt PE” in expectation of a higher return and appreciation in stock price. In case the Interest rate goes up, lets say, from 6% to 8%, that means Debt PE has fallen from 16.6 to 12.5. The market PE remains the same at lets say 20, money will move from the market to Debt as the investor will not be willing to pay a spread or premium of 7.5 PE to the market.
Investors are willing to pay different multiples for different companies and different sectors based on the characteristics of the Industry or sector, e.g. A company with a high debt will command a lower multiple as compared to a company with zero debt.
Similarly, an industry which is capital intensive and has a longer gestation will command a lower price earnings multiple as compared to a less capital intensive industry. Thus the companies in different sectors trade at different PE multiples. Similarly gross operating margins or ROCE of different sectors or companies impact their PE ratios and multiples they trade at.
The market hates uncertainty and thus any company where earnings or growth are uncertain due to any reason, the price multiples are immediately impacted.
Thus comparing companies only on their PE is a folly and should be avoided as the reasons for their price behavior are different.
The market values growth and thus, a company which has a high growth rate trades at a higher multiple. This makes economic sense too as a company which is growing at lets say 25% will only take 3 years and less to double its profits as compared to a company growing at 12% which shall take 6 years to double its profits and thus its price.
Most mature market investors or fund managers rely on PEG ratio rather than PE.

The PEG ratio helps you consider a stock’s growth rate when evaluating its valuation. In general, a PEG ratio of less than 1 is considered to be indicative of an undervalued stock and a PEG ratio of more than 1 could imply that a stock is expensive. While using PEG ratio investors must also see that if the company is growing earnings but similar growth is not seen in the free cash flow then it may need further investigation.
Even though PEG is a good indicator, it should be used along with other criteria like Earnings Yield, other ratios like ROE, ROCE, ROIC, FCF growth rate, etc.
Another common mistake which most investors and analysts make is to do an Index PE comparison with earlier years, e.g. Nifty PE comparison in 2008 & in 2018 to draw conclusions on whether the market is overvalued or undervalued.
Though broadly it may give some indication on valuations, but one must remember and also look at the constituents of the NIFTY in those 2 periods. The NIFTY 50 in 2018 has more weightage of Financial services, FMCG, etc as compared to 2005 & these sectors trade at higher multiples as compared to cyclicals, Energy, metals, Oil & gas etc which had a higher weightage in 2008.

As mentioned earlier, Constituents change and different sectors have different PEs based on Capital investment, Profitability, Gestation period, W Cap cycles, business cycles etc. and these things need to be kept in mind too when comparing and deciding on market valuations.
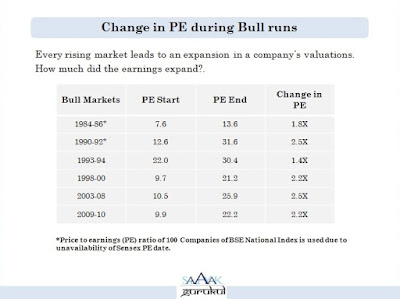
Another thing to be kept in mind is that based on market sentiment, macros, liquidity, interest rates and bond yields etc, the investors may be willing to pay a higher or lower PE for the same investment. This leads to what is commonly known in market parlance as PE Expansion and contraction. A typical Bull Run will have both, a growth in earnings and a component of PE Expansion.
The sustainability of the Bull run depends on what % contribution has been due to the above two factors.
Thus, it is best to consult a financial advisor who understands the dynamics of the market and knows how to use different valuation techniques to arrive at the optimum mix for the achievement of your investment and financial goals.
Happy Investing!
Stay Blessed Forever!
Sandeep Sahni
You may contact us at:
91-9888220088, 9814112988
sandeepsahni@sahayakassociates.com,
Follow us on:
www.facebook.com/sahayakassociates,
www.twitter.com/sahayakassociat,